The Allocation Dashboard provides transparency and additional detail about Strategy performance versus their targets. It displays the information underlying the forecasts to help you understand what will change at the campaign level and how the decisions are being made.
Accessing the Allocation Dashboard
- Navigate to the usual grid.
- Open the 'Optimize' navigation bar on the left.
- Click on the 'Allocation' section to bring up the dashboard.
Allocation Dashboard - Overview
The first view of the allocation dashboard summarizes the performance of each strategy against its target. Because you can target spend, ROAS or CPA, the units shown on the chart may differ from row to row. The horizontal axis of the chart is in logarithmic scale to make it easier to see all your strategies on one chart.
The grid below the chart displays additional details about the strategy, including the date range for the current episode. Click ∞ in the Detail column to see more information about a strategy.
Dates on the Allocation Dashboard
The allocation dashboard displays the dates for the current episode, but different strategies may use varying dates based on their goal types. Learn more about Strategy Episodes.
Allocation Dashboard - Detail
The Detail view of the allocation Dashboard provides a wealth of information for understanding how a Strategy using Marin will perform. The data displayed will match the Strategy goal, so the charts may focus on ROAS, CPA or spend depending on your objective.
Dashboard Controls
If you hover over a chart, there are controls to expand the chart to full screen and download the data. You can also increase the width of the legend by hovering over its left edge.
Strategies
The first table summarizes the Strategy with details about the target, performance to date and forecasted results.
Spend Forecast, by Day
This chart shows the actual and projected spend for the entire episode. It also includes Target, Budget, and Impression Share metrics to help understand the drivers of the spending. The gray forecast bars in this chart are connected to the “Show Forecast by” control at the top of the page. You can select either the “status quo” forecast with no changes or “with Marin recommendations,” which is what to expect when you turn enable Marin to send changes to the ad platforms.
Conversion, Revenue, and Spend by Campaign
These “before and after” charts show the impact Marin's optimization on when setting up a new strategy. The left side of each chart is the “status quo” or what we forecast the campaigns in the strategy will achieve with no changes in settings. The right side of the chart shows the predicted results with Marin pushing changes to the publisher.
Only 10 campaigns with the most spend appear on this chart, any additional campaigns aggregate in the Other bar.
Use the controls on the left to show these charts for the entire episode or only the remaining dates. For a spend target, the episode is based on the calendar month, so Future Dates will show only the remaining days in the month. For an efficiency target (ROAS or CPA), the episode is a rolling 28 days that combines the last two weeks with the next two weeks. The Future Dates option shows only the next two weeks.
Campaign Simulations by Target Change
These charts are the campaign-level simulations used to calculate the optimal distribution of spend across the campaigns in the strategies. The vertical line at 0 represents the current campaign settings, and the curve shows how spend (on the left) and conversions or conversion value (on the right) will change as the targets increase or decrease for the campaign.
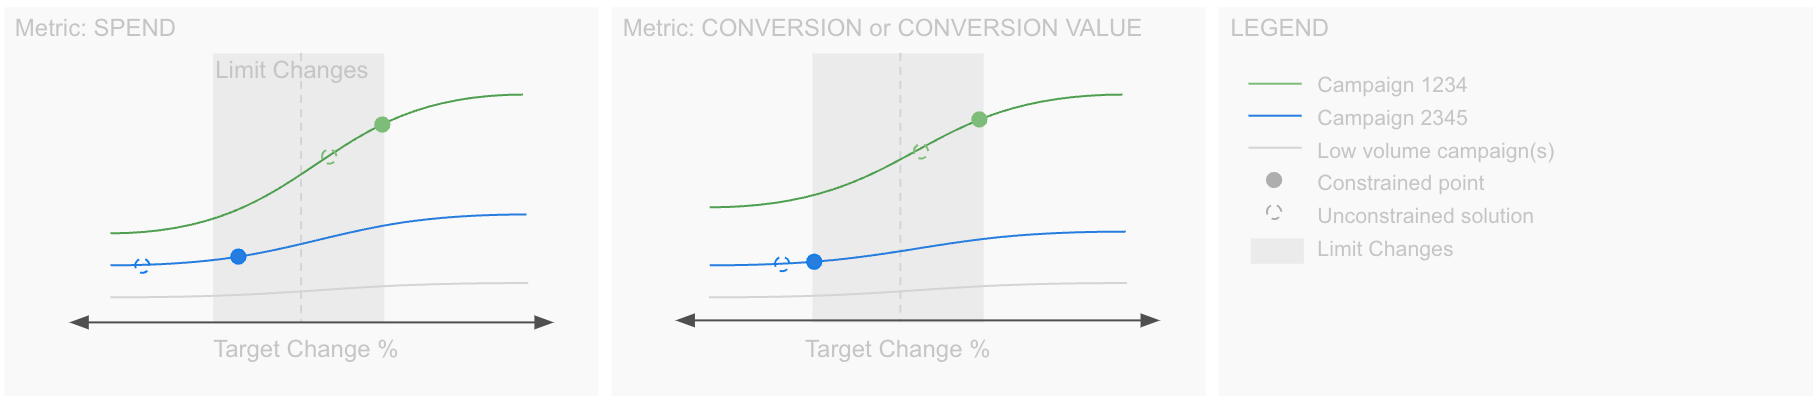
The Marin recommendations are shown with the circles on the curve. The solid circle shows the “constrained recommendation” which factors any rules applied to the Strategy. The dotted circle represents the “unconstrained recommendation” which would result if the rules were not applied. Note that it is possible for these two recommendations to move in opposite directions.
If there is not a dotted circle, the two recommendations are the same. These recommendations are available as columns in the campaign grid.
The top ten spending campaigns will be shown with a unique color, the other campaigns in the strategy will be gray.
Campaign Simulations by Spend
This chart combines the two charts above, showing the same set of campaigns but with Conversions (or Revenue) plotted against spend. The vertical line on each series represents the current spend, and the dots indicate the recommended values. The dotted circle represents the “unconstrained recommendation” which would result if the rules were not applied. Note that it is possible for these two recommendations to move in opposite directions.
Conversions by Day
This chart shows the actual and projected conversions (or revenue) for the entire episode. It also includes Target CPA and Forecast CPA. The gray forecast bars in this chart are connected to the “Show Forecast by” control at the top of the page. You can select either the “status quo” forecast with no changes or “with Marin recommendations,” which is what to expect when you enable Marin to send changes to the ad platforms.
Campaigns and Campaign Recommendations
These tables list all the campaigns mapped to the strategies and summarize the forecast performance and recommended targets.
Additional Details
- Not all campaigns have an optimal solution: some campaigns are considered non-reallocatable so won't appear in the solution set; this is expected. A good example is a campaign on publisher bidding with an incompatible type - e.g. TargetImpressionShare.
- Custom Horizontal Scale: Focuses on the range of -25% to +25% relative change in target, with compressed scales for more extreme changes, ensuring detailed visibility in the most relevant range.
- Data Refresh Rate: The charts are refreshed every six hours. Plans are in place to sync this with the rest of the Dashboard data for more timely updates.
